12-week serum level curve
Laboratory Tools
Ester Half-Life Plotter
Plot estimated active-compound levels across a 12-week protocol for testosterone, nandrolone, trenbolone and other esters.
Model the curve, plan the protocol.
Every ester releases active compound at its own rate. Plot a simplified 12-week first-order pharmacokinetic model for any ester in the Vyroval catalog, or open Sustanon 250 to see its four-ester blend decompose into individual release curves.
Modelled remaining fraction — 12 weeks
first-order PK model · estimates only
Reference ester data
| Compound | Est. half-life | Active fraction |
|---|---|---|
| Testosterone Enanthate | 4.5 days | 72% |
| Testosterone Cypionate | 8 days | 70% |
| Sustanon 250 (blend) | 8 days | 69% |
| Trenbolone Acetate | 2 days | 87% |
| Nandrolone Decanoate | 15 days | 64% |
| Boldenone Undecylenate | 14 days | 63% |
| Drostanolone Propionate | 4.5 days | 84% |
| Methenolone Enanthate | 10 days | 73% |
| Stanozolol (oral) | 0.5 days | 100% |
| Oxandrolone (oral) | 0.5 days | 100% |
| Methandrostenolone (oral) | 0.5 days | 100% |
| Sustanon 250 — Propionate | 2 days | 86% · 30 mg |
| Sustanon 250 — Phenylpropionate | 4.5 days | 77% · 60 mg |
| Sustanon 250 — Isocaproate | 8 days | 72% · 60 mg |
| Sustanon 250 — Decanoate | 15 days | 64% · 100 mg |
Share this calculation
How it works
The model behind the curve
First-order elimination
C(t) = Σ dose × active% × e^(−k·Δt), k = ln2 / half-life
Each dosing interval contributes a decaying amount in the reference model; the curve sums every prior contribution — pharmacokinetic arithmetic from published half-lives, not personal advice. The active fraction (e.g. testosterone enanthate is 72% active hormone by mass).
Sustanon 250 — four esters, four curves
Each 250 mg/mL of Sustanon contains 30 mg propionate (~2 day half-life, fast release), 60 mg phenylpropionate (~4.5 days),60 mg isocaproate (~8 days) and 100 mg decanoate(~15 days, slow release). The plotter draws each ester separately plus the combined total — the same decomposition used in published multi-ester pharmacokinetic analysis.
Steady state
≈ 5 × half-life
After roughly four to five half-lives, input equals elimination and peaks become predictable. The plotter reports the steady-state peak, trough and swing from the final four weeks of the run.
This is a simplified single-compartment model with population-average half-life estimates (Behre & Nieschlag 1998, and PubChem molecular-weight data). Individual variation is significant. For laboratory research context only — not medical advice.
FAQ
Frequently asked questions
From the catalog
Related compounds
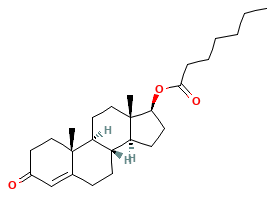
Testosterone Enanthate
Long-ester testosterone. 250mg/mL in USP-grade carrier oil.
CAS 315-37-7
10mL vial · In stock
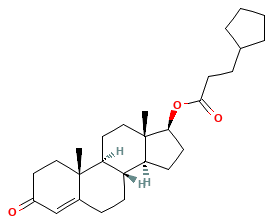
Testosterone Cypionate
Cyclopentyl ester testosterone. Extended half-life profile.
CAS 58-20-8
10mL vial · In stock
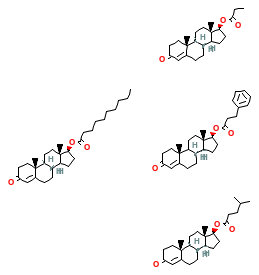
Sustanon 250
Four-ester testosterone blend. Extended release profile.
CAS 68924-89-0
10mL vial · In stock
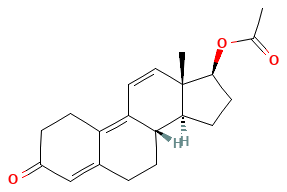
Trenbolone Acetate
19-nor anabolic compound. High receptor binding affinity.
CAS 10161-34-9
10mL vial · In stock
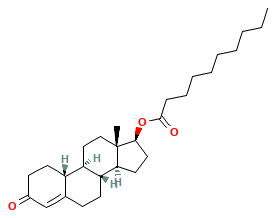
Nandrolone Decanoate
19-nor decanoate ester. Long-acting reference compound.
CAS 360-70-3
10mL vial · In stock
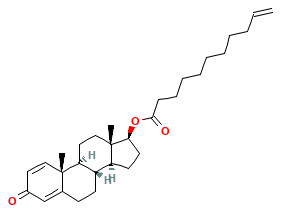
Boldenone Undecylenate
Undecylenate ester. Sustained-release anabolic standard.
CAS 13103-34-9
10mL vial · In stock
For laboratory research use only